Select years to invest
5
10
15
20
25
30
Select growth rate*:
7%
5%
3%
Cash savings only (no plan)
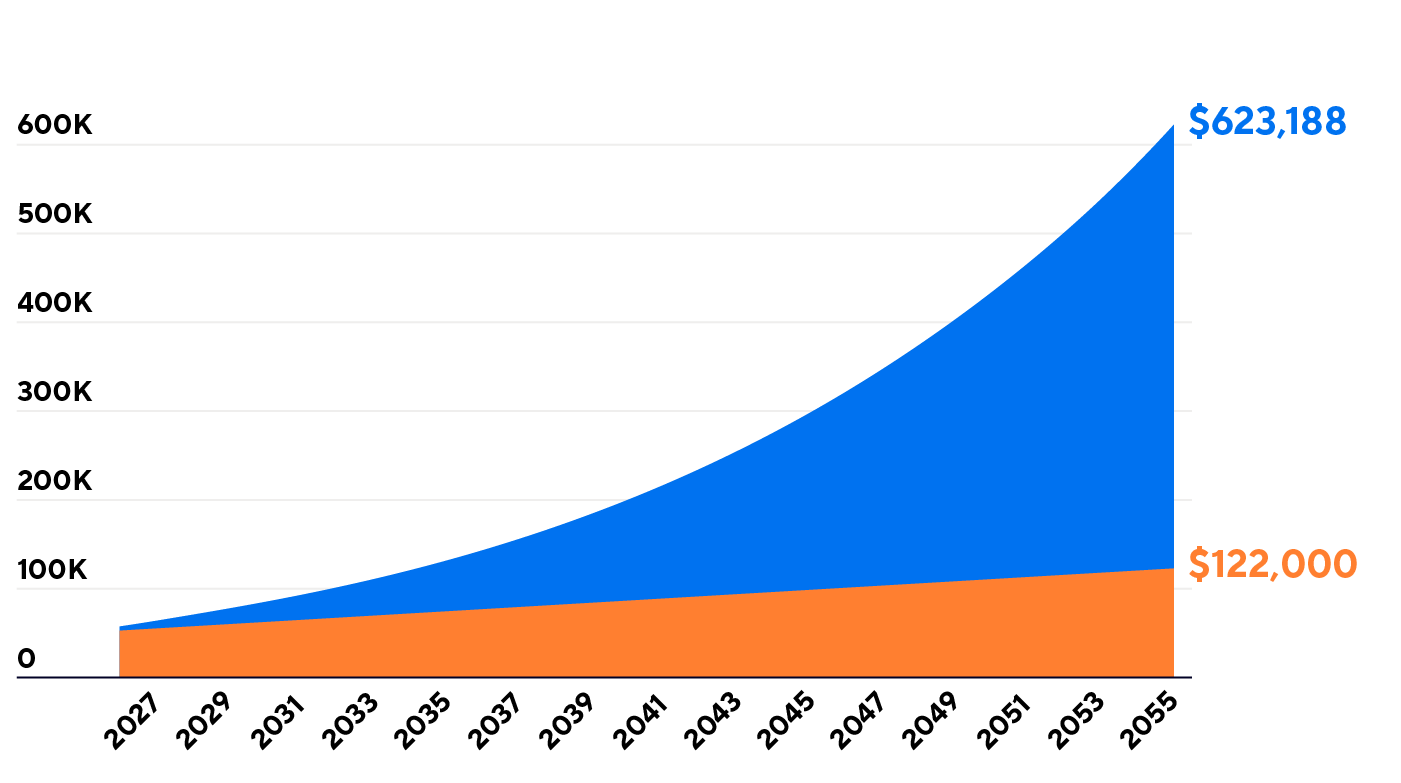
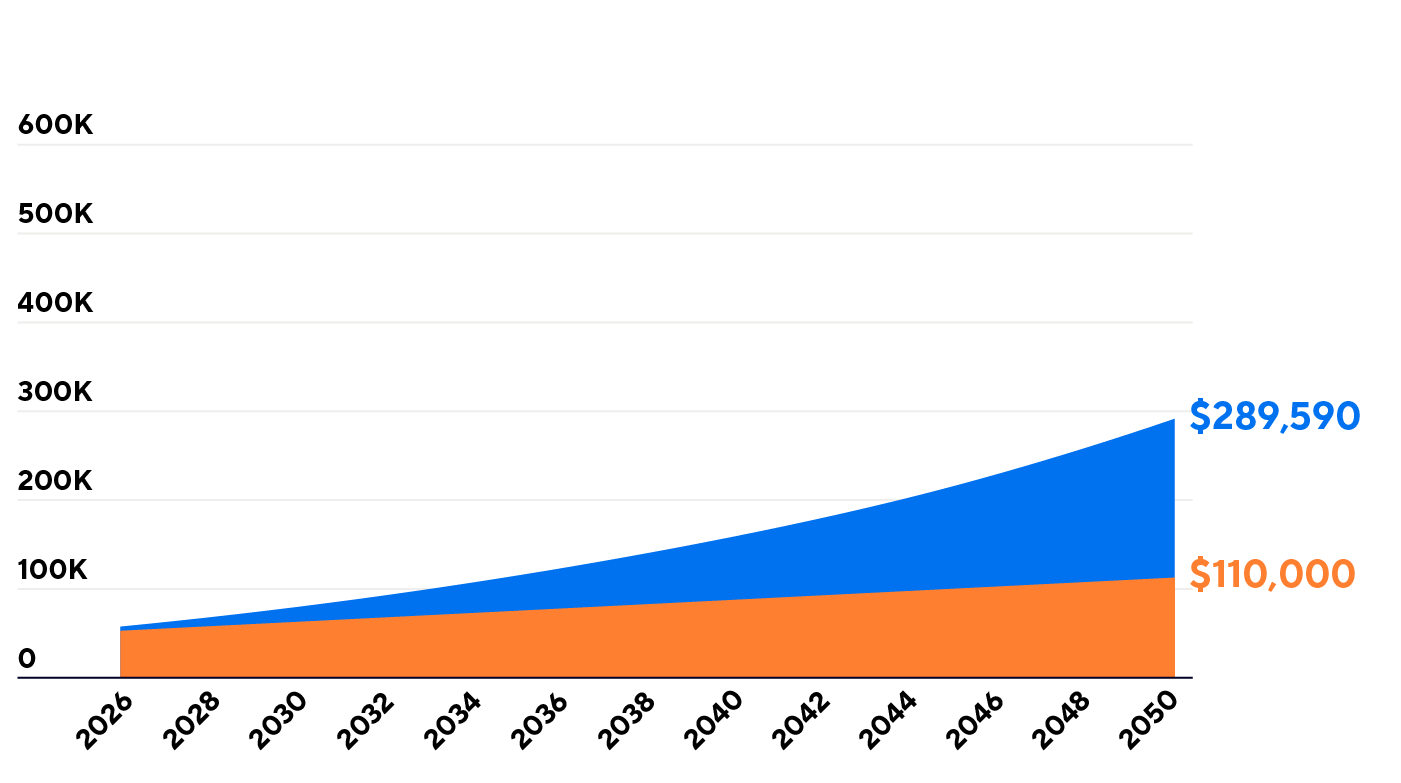
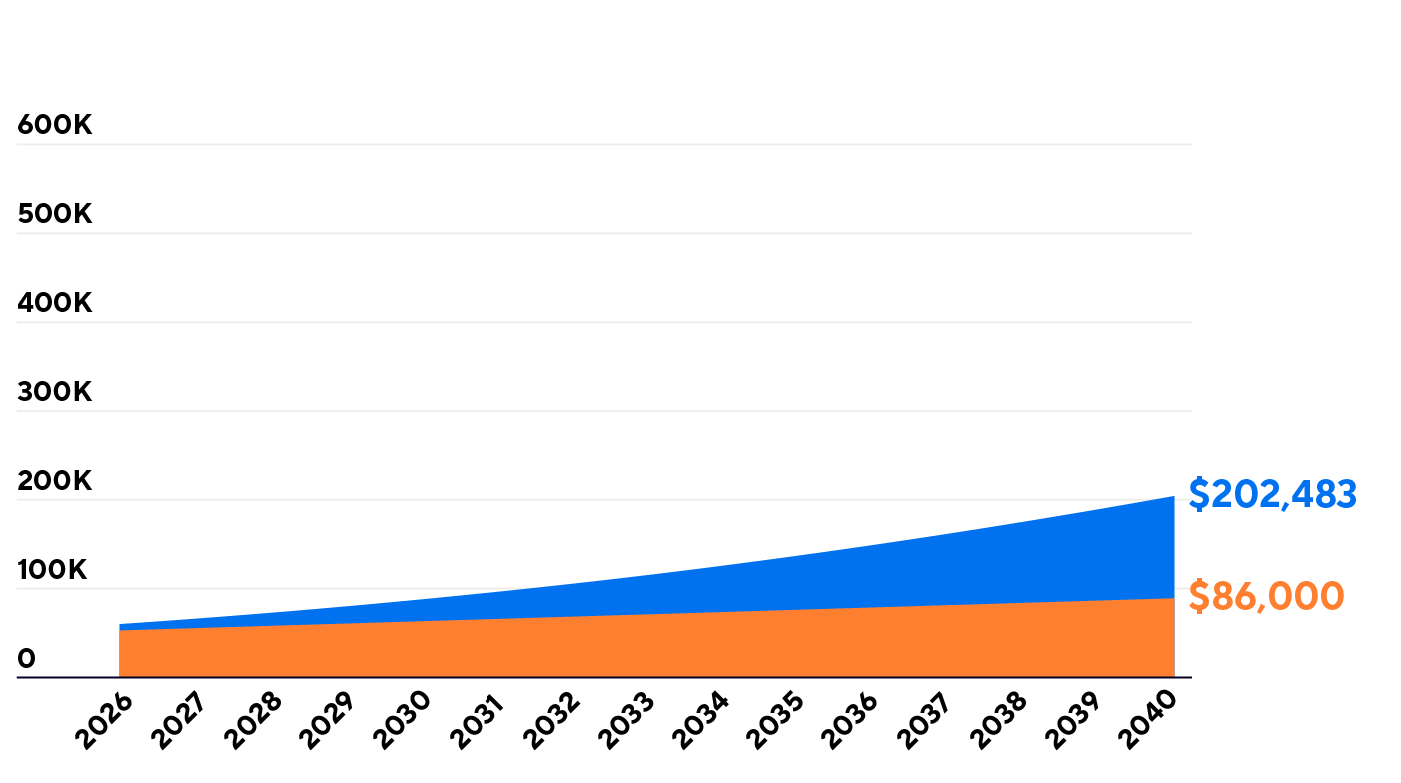
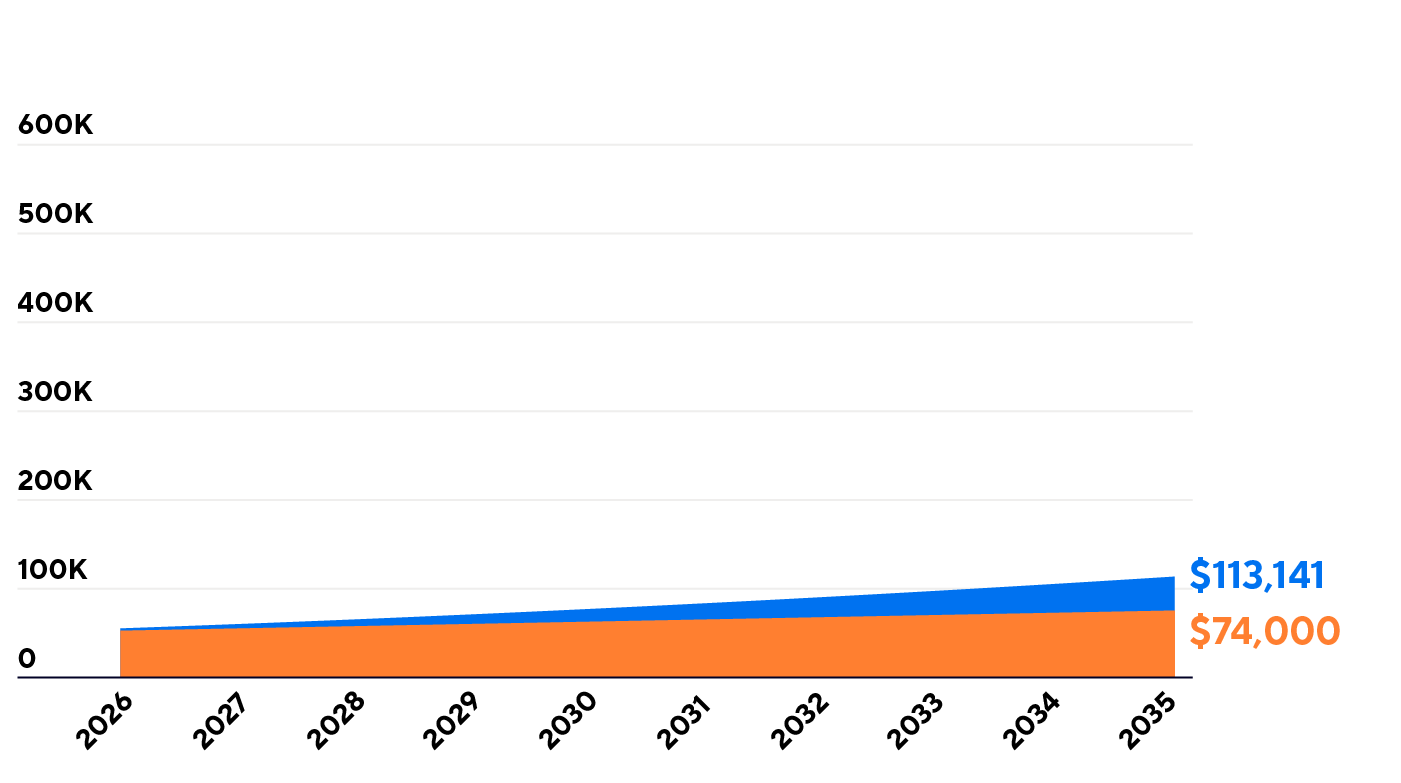
Projected savings with a plan
$50K starting balance + $2,400 annual contribution + 7% growth
Select growth rate*:
7%
5%
3%
Cash savings only (no plan)
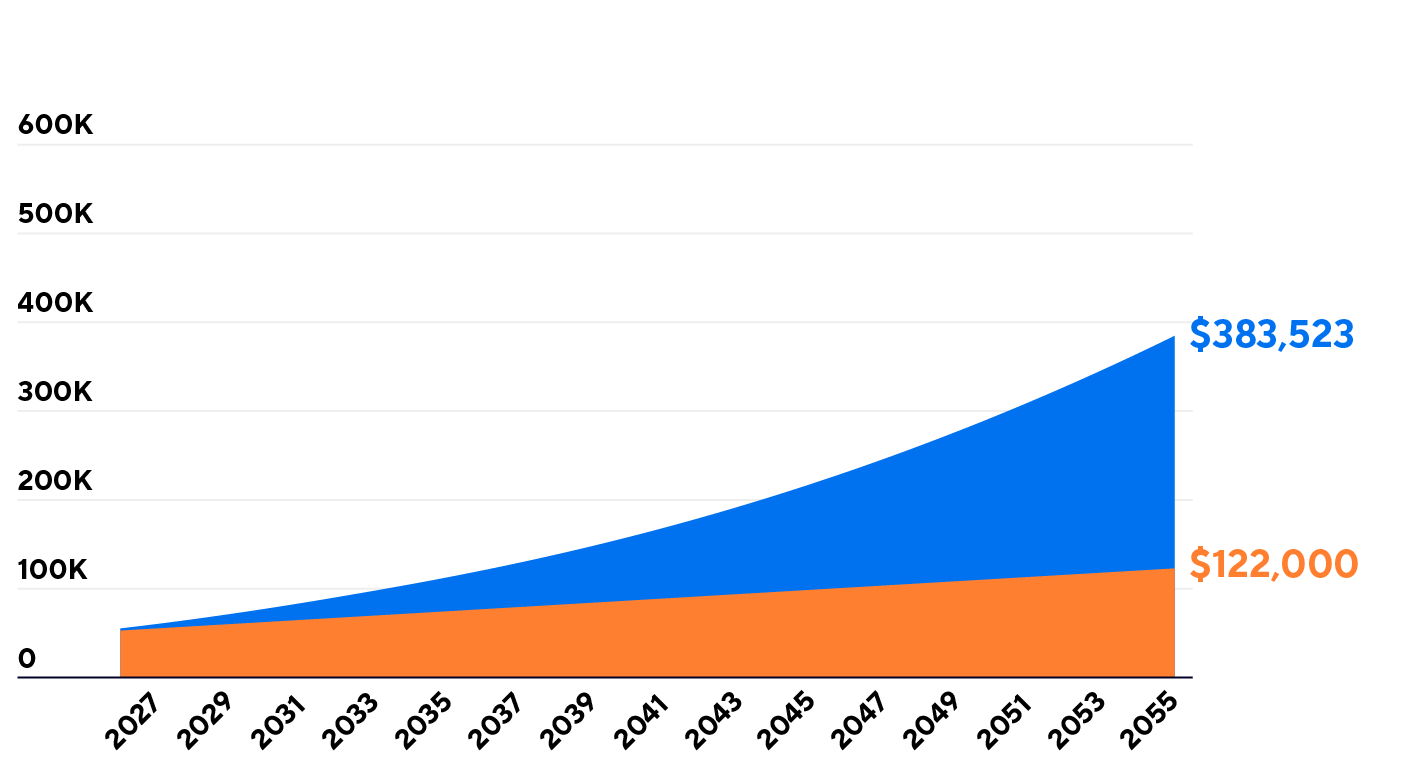
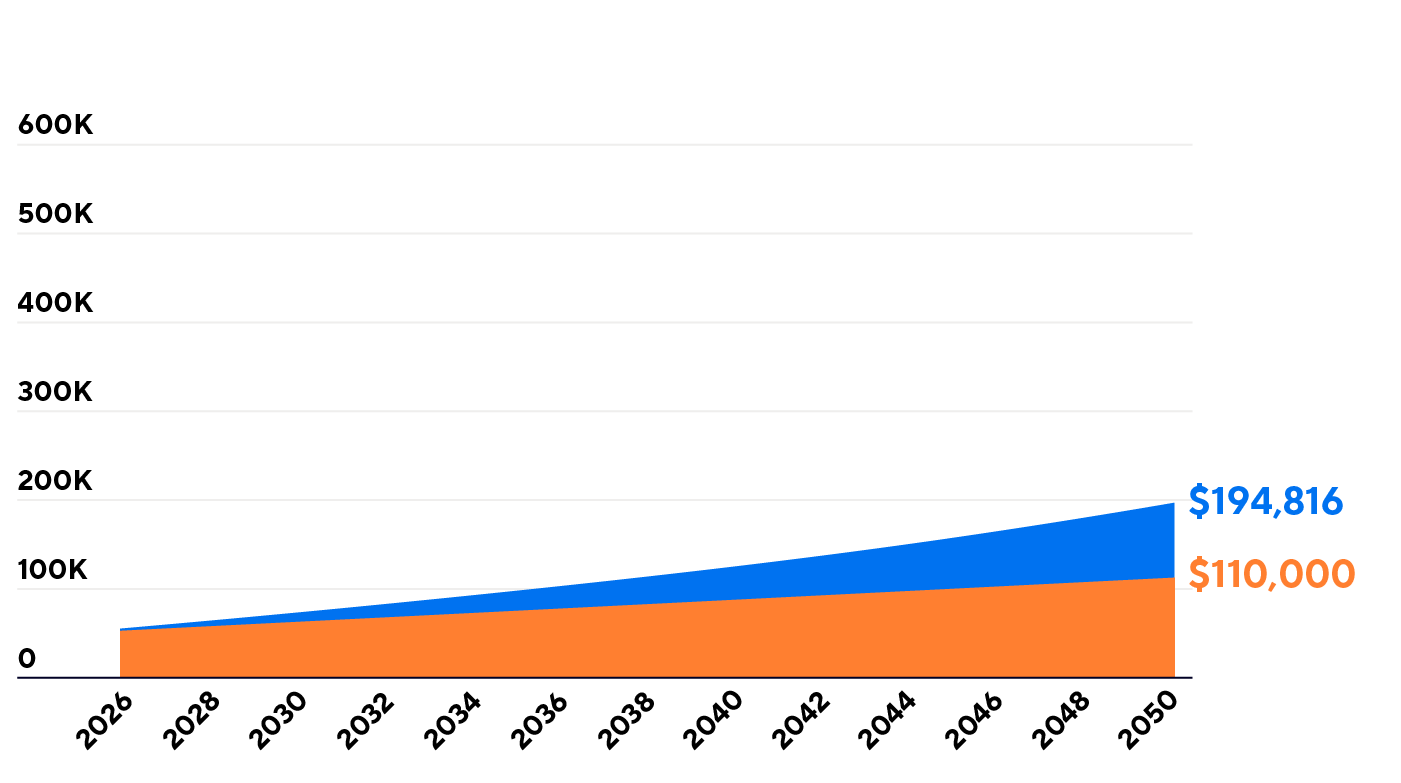
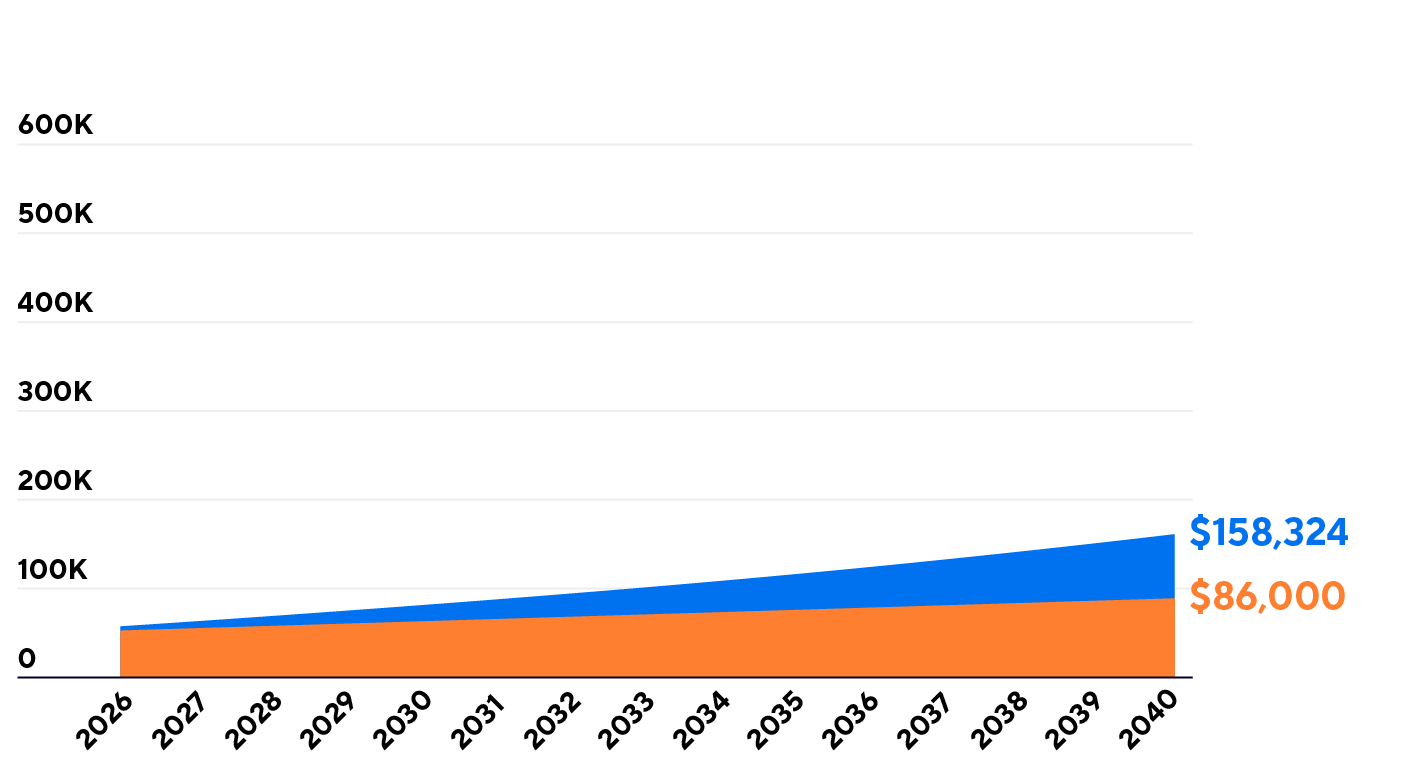
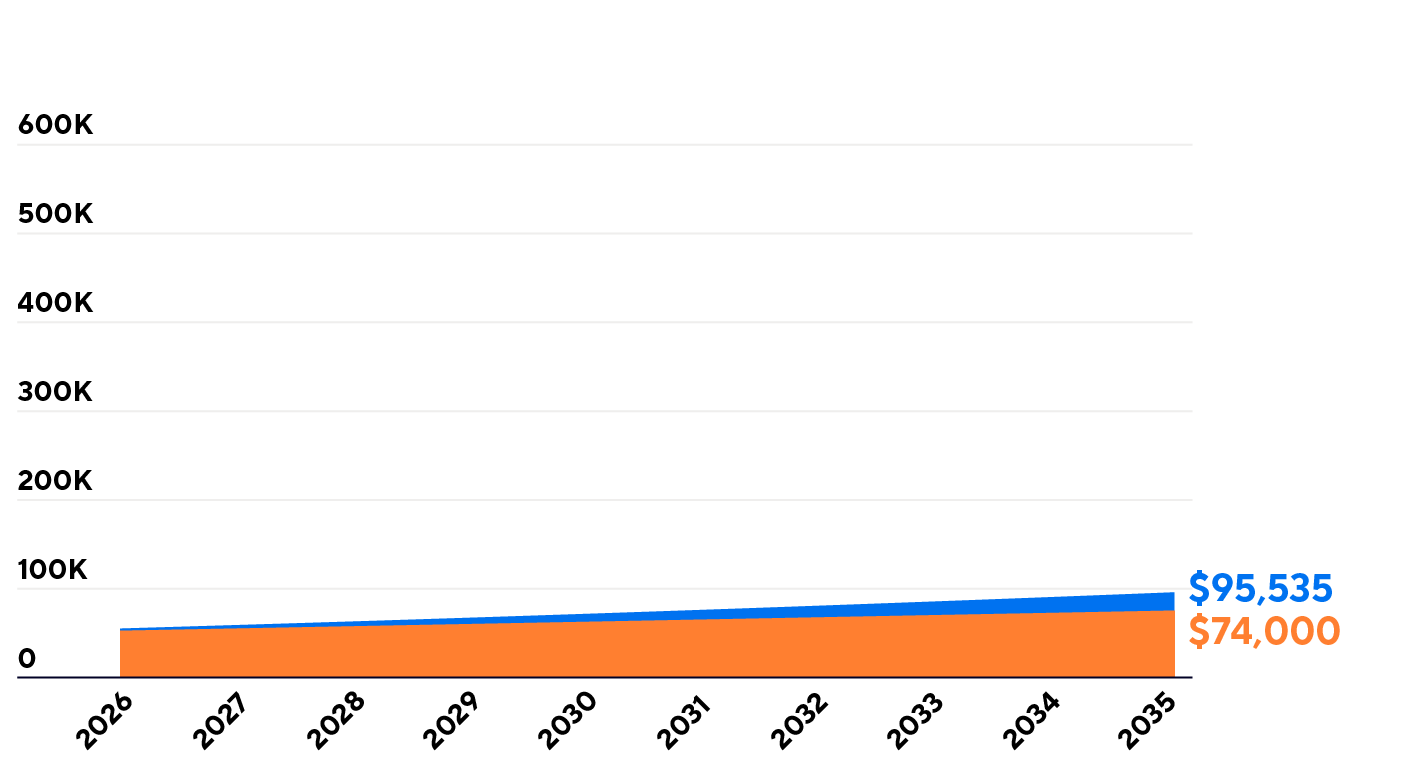
Projected savings with a plan
$50K starting balance + $2,400 annual contribution + 5% growth
Select growth rate*:
7%
5%
3%
Cash savings only (no plan)
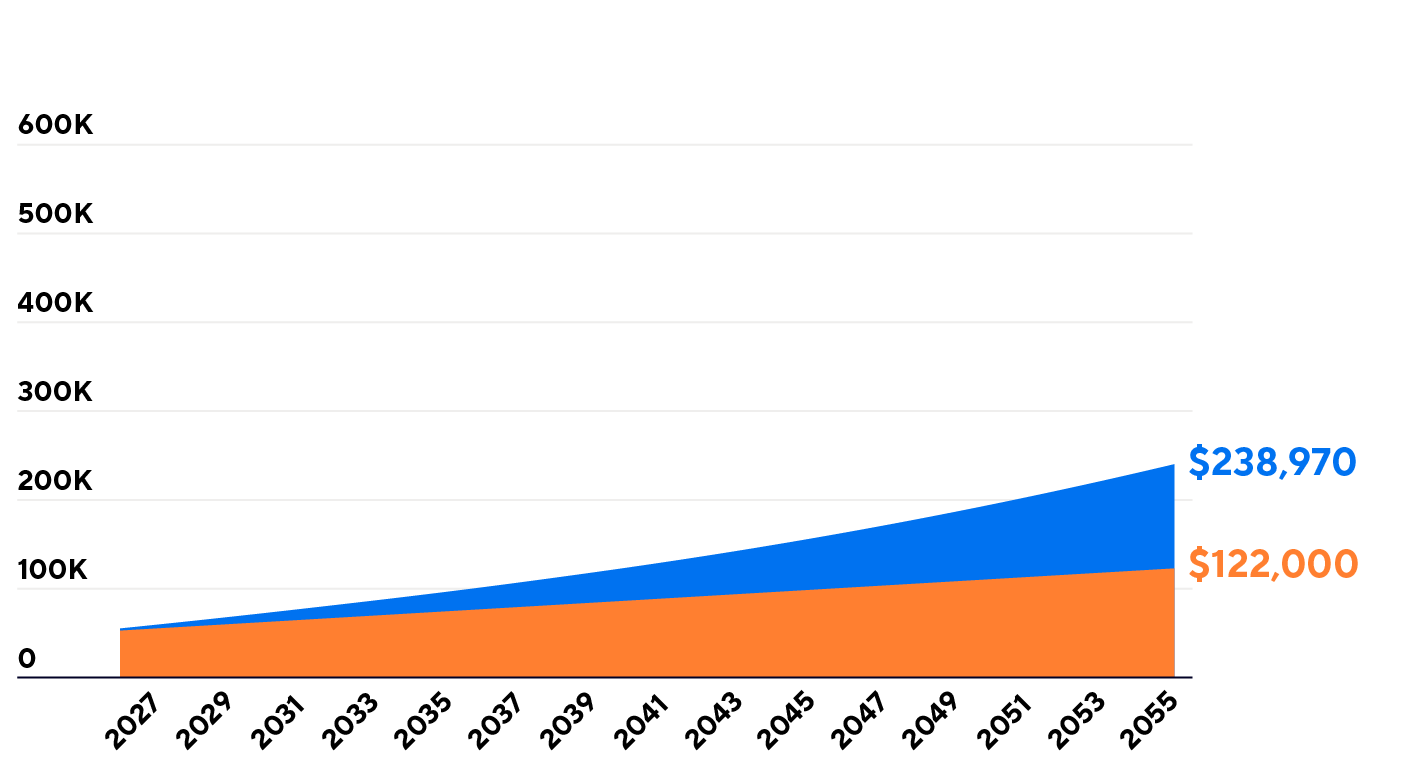
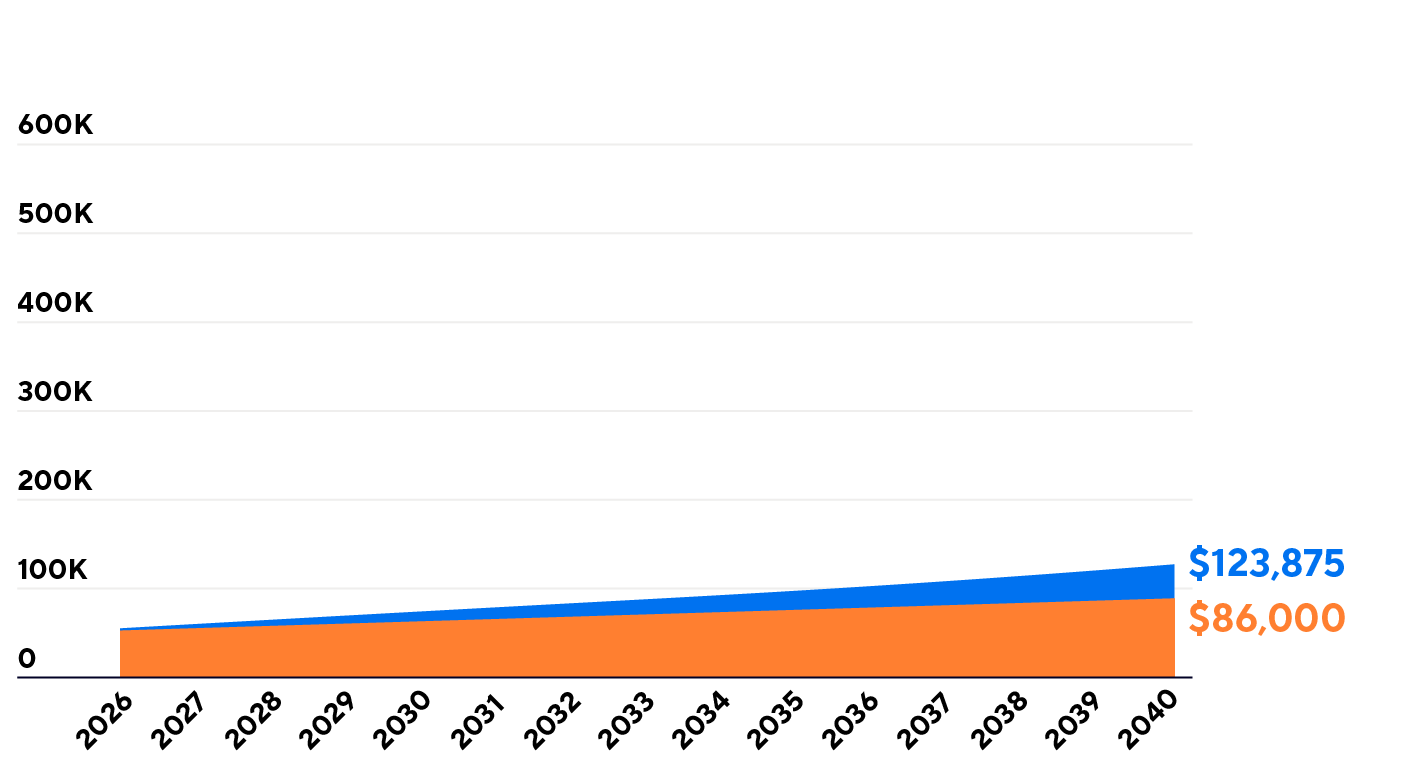
Projected savings with a plan
$50K starting balance + $2,400 annual contribution + 3% growth
Select years to invest
5
10
15
20
25
30
Select growth rate*:
7%
5%
3%
Cash savings only (no plan)
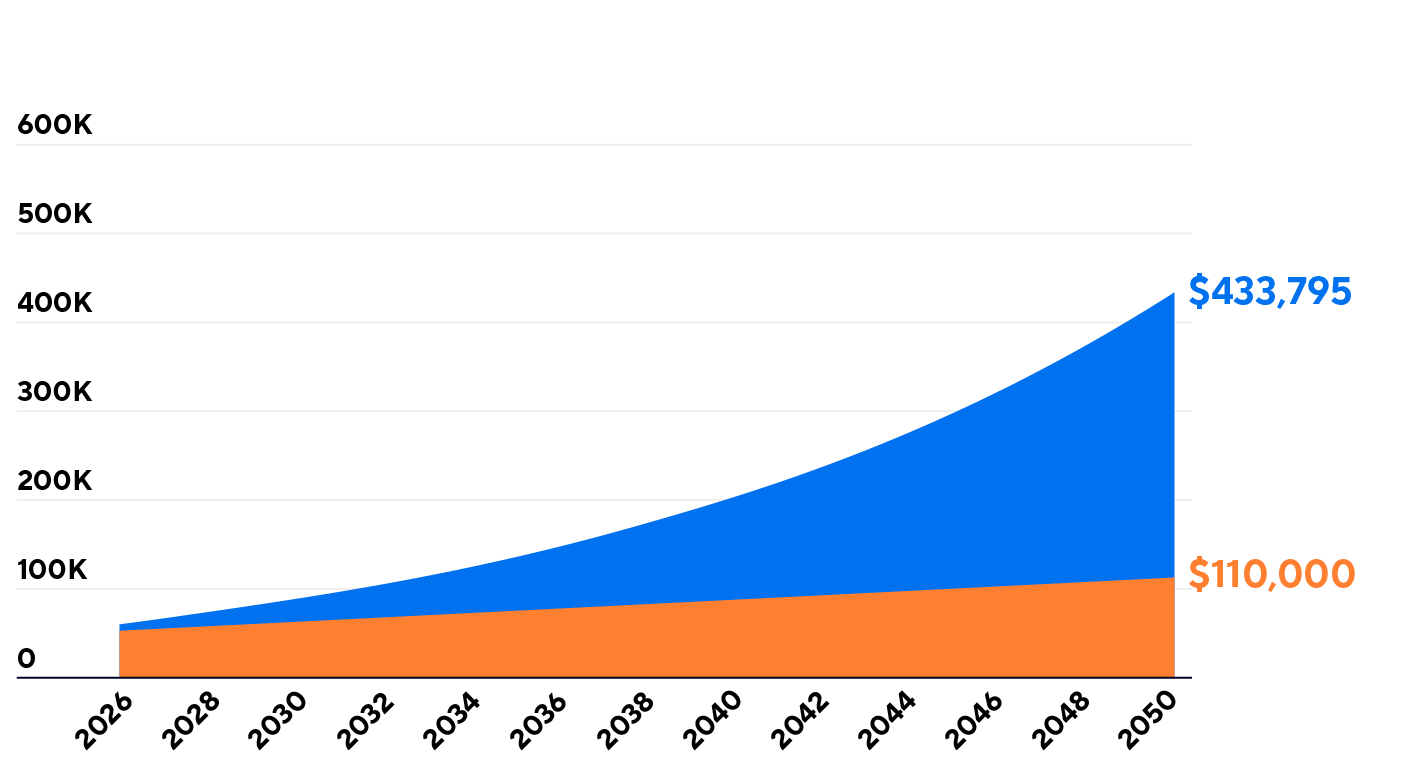
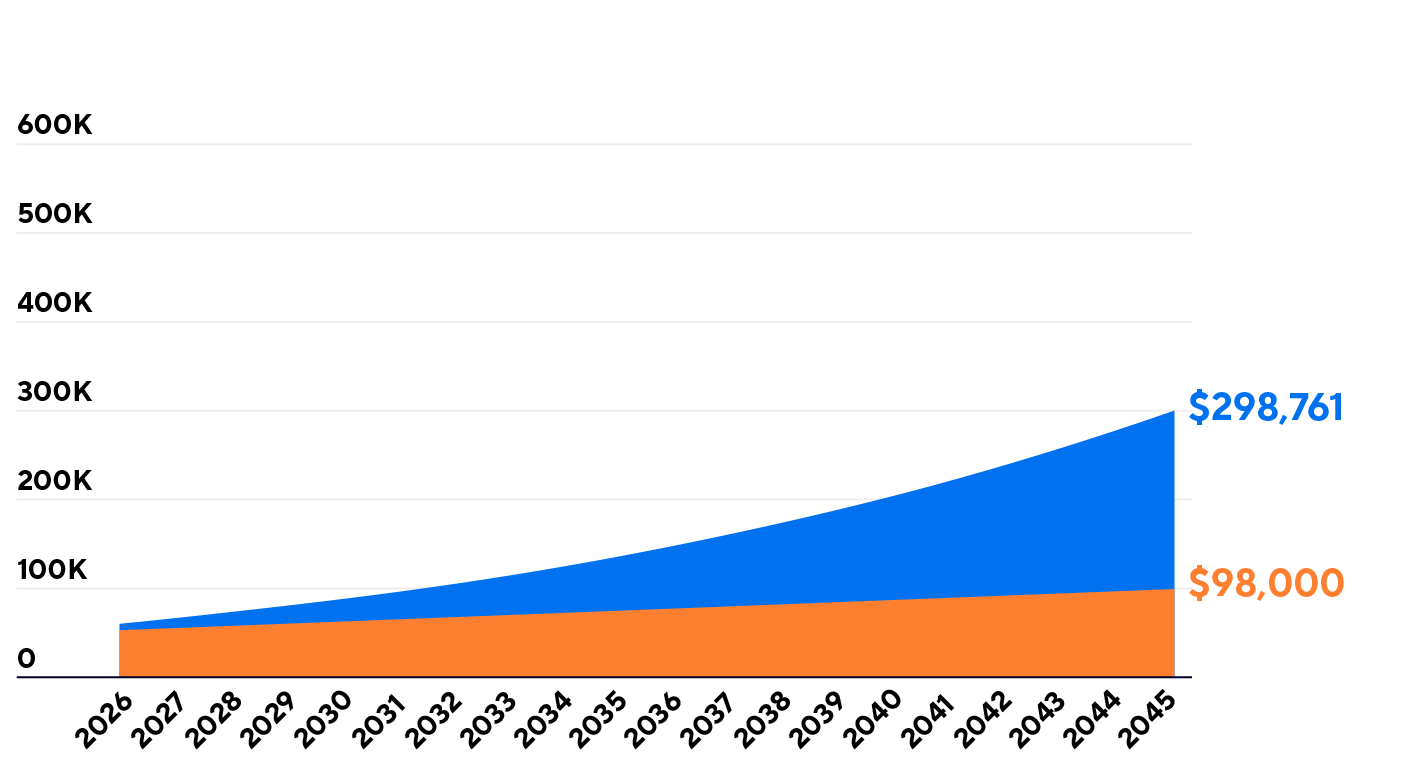
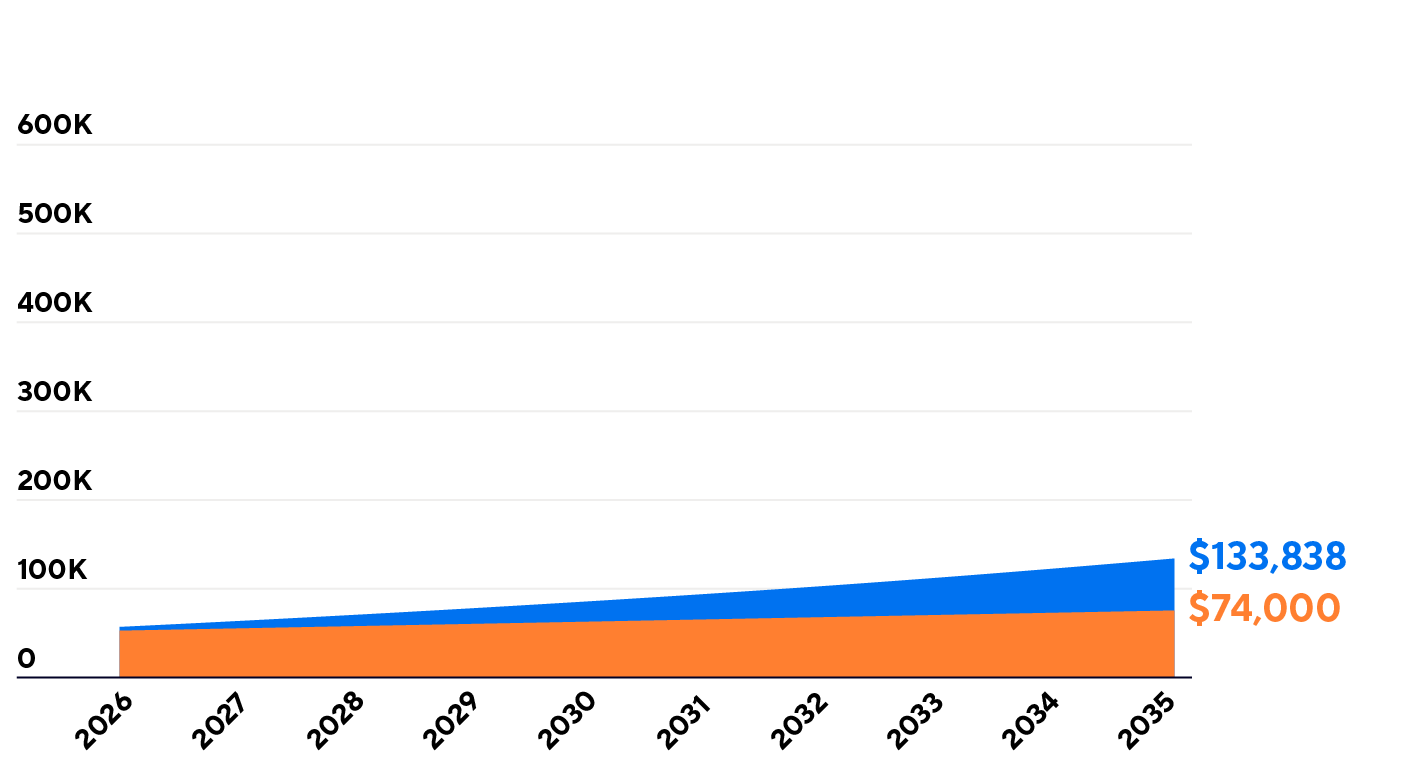
Projected savings with a plan
$50K starting balance + $2,400 annual contribution + 7% growth
Select growth rate*:
7%
5%
3%
Cash savings only (no plan)
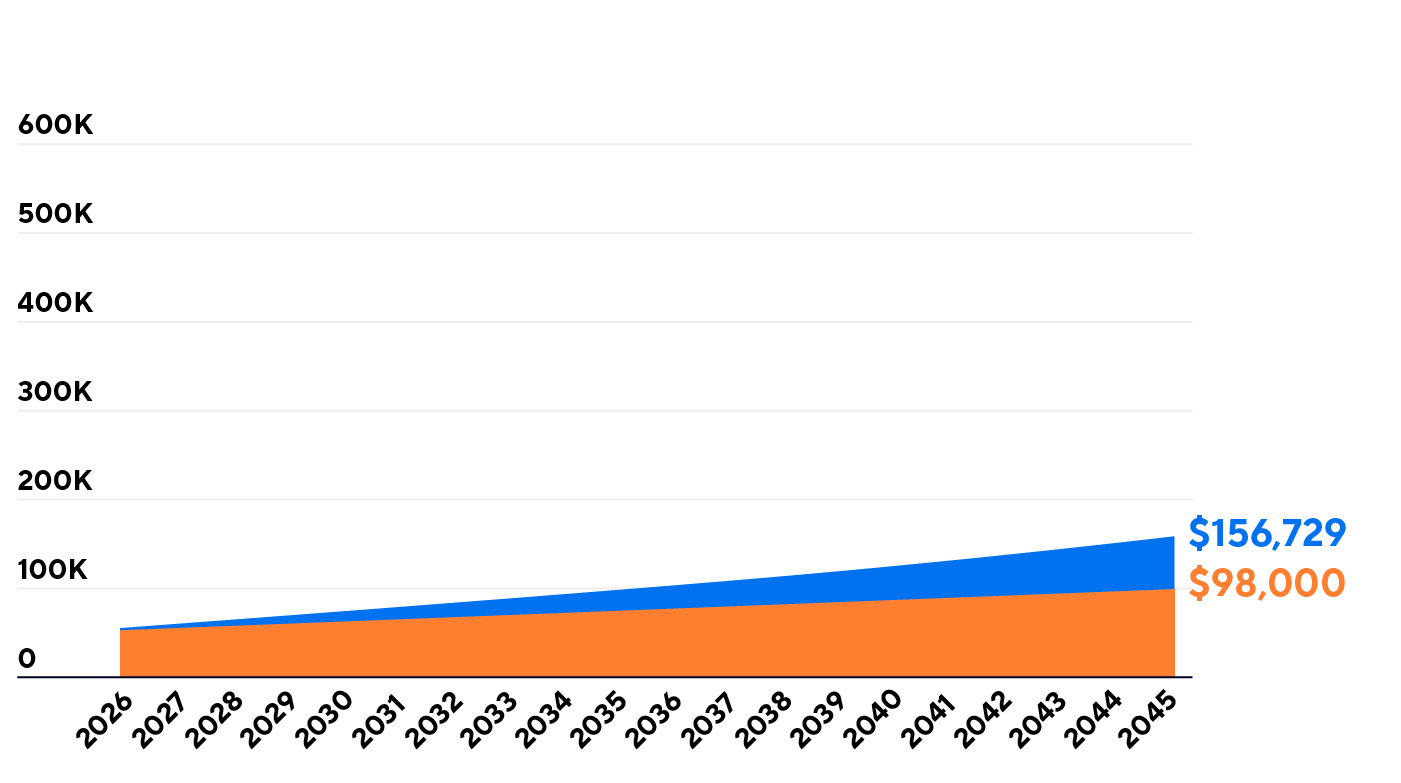
Projected savings with a plan
$50K starting balance + $2,400 annual contribution + 5% growth
Select growth rate*:
7%
5%
3%
Cash savings only (no plan)
Projected savings with a plan
$50K starting balance + $2,400 annual contribution + 3% growth
Select years to invest
5
10
15
20
25
30
Select growth rate*:
7%
5%
3%
Cash savings only (no plan)
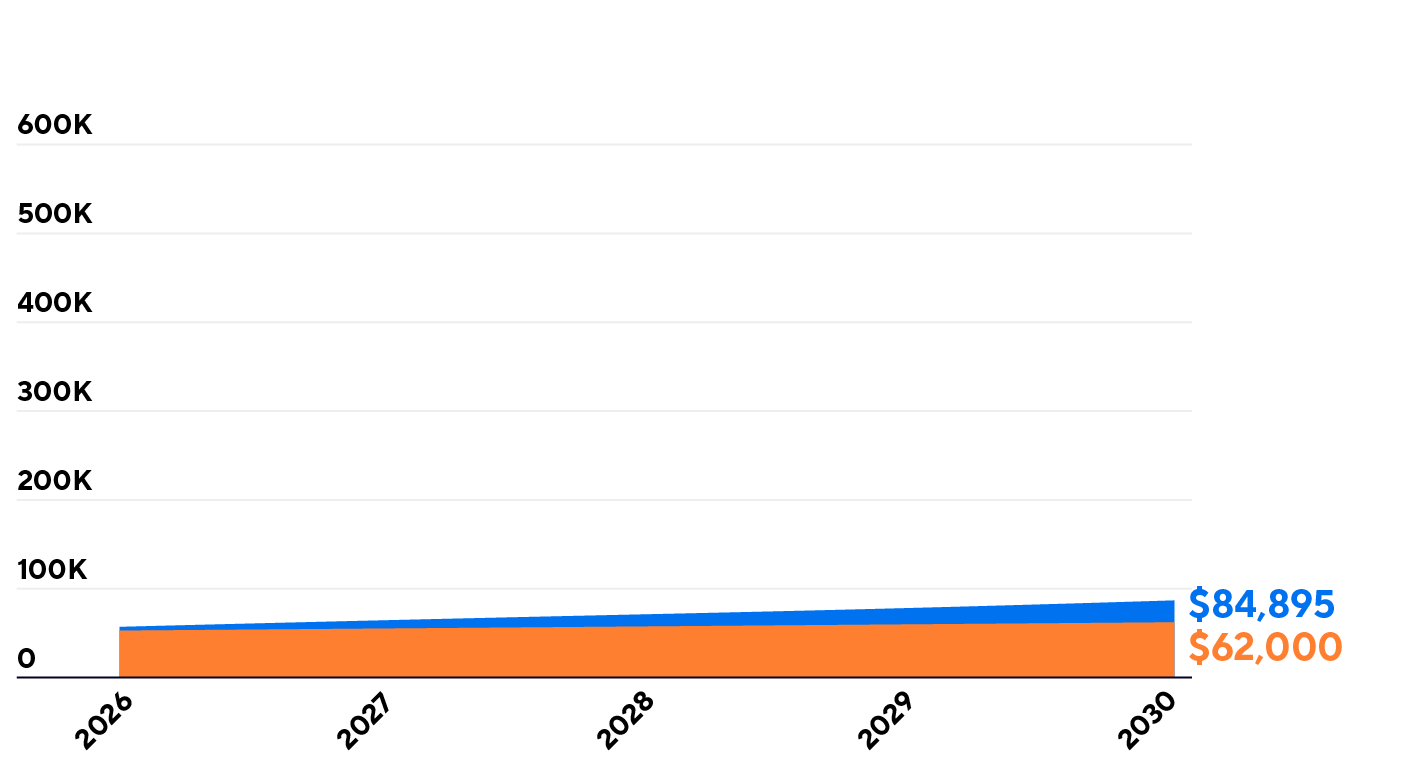
Projected savings with a plan
$50K starting balance + $2,400 annual contribution + 7% growth
Select growth rate*:
7%
5%
3%

Cash savings only (no plan)
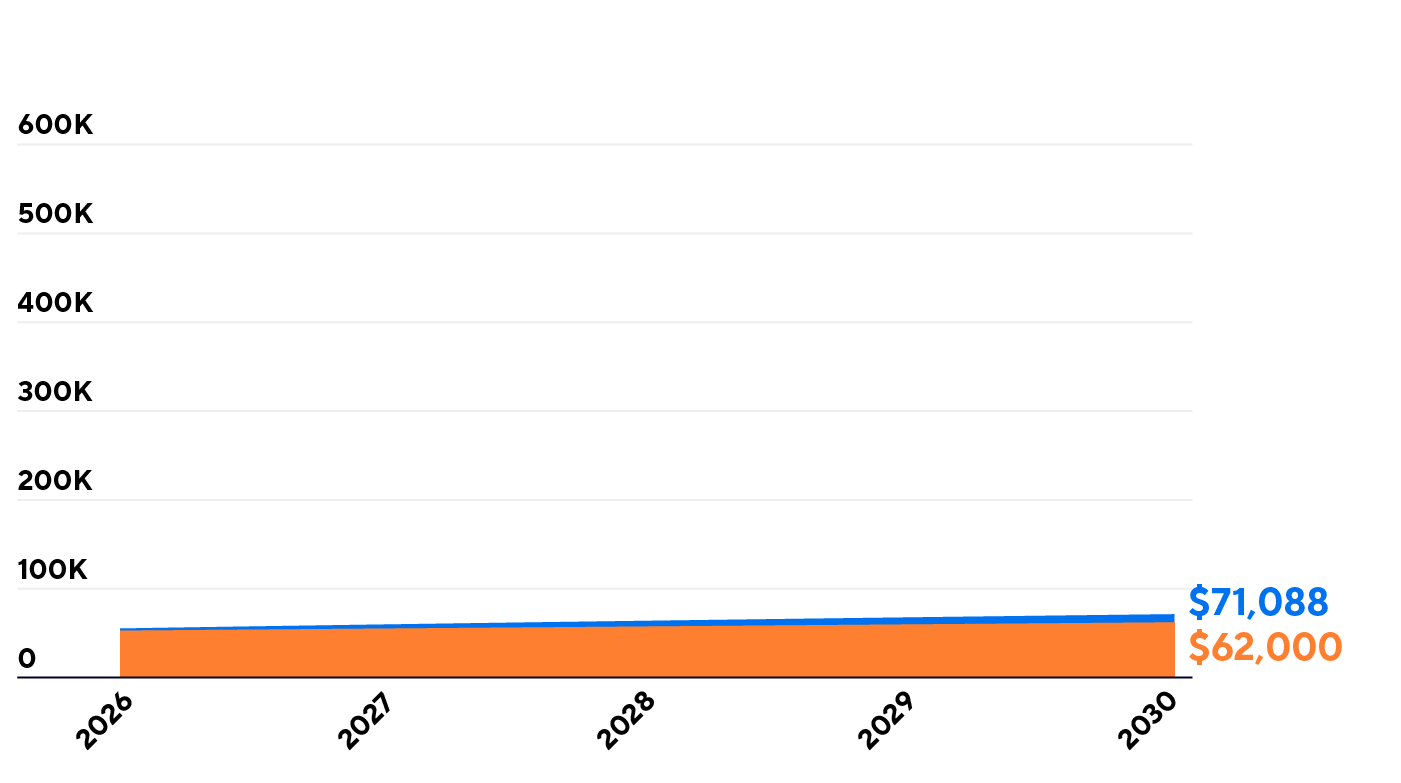
Projected savings with a plan
$50K starting balance + $2,400 annual contribution + 5% growth
Select growth rate*:
7%
5%
3%
Cash savings only (no plan)
Projected savings with a plan
$50K starting balance + $2,400 annual contribution + 3% growth
Select years to invest
5
10
15
20
25
30
Select growth rate*:
7%
5%
3%
Cash savings only (no plan)
Projected savings with a plan
$50K starting balance + $2,400 annual contribution + 7% growth
Select growth rate*:
7%
5%
3%
Cash savings only (no plan)
Projected savings with a plan
$50K starting balance + $2,400 annual contribution + 5% growth
Select growth rate*:
7%
5%
3%
Cash savings only (no plan)
Projected savings with a plan
$50K starting balance + $2,400 annual contribution + 3% growth
Select years to invest
5
10
15
20
25
30
Select growth rate*:
7%
5%
3%
Cash savings only (no plan)
Projected savings with a plan
$50K starting balance + $2,400 annual contribution + 7% growth
Select growth rate*:
7%
5%
3%

Cash savings only (no plan)
Projected savings with a plan
$50K starting balance + $2,400 annual contribution + 5% growth
Select growth rate*:
7%
5%
3%
Cash savings only (no plan)
Projected savings with a plan
$50K starting balance + $2,400 annual contribution + 3% growth